BTST Nifty Strategy: Heikin Ashi vs Normal Candles
What Is a BTST Trading Strategy?
BTST (Buy Today, Sell Tomorrow) is a short-term trading approach where traders take a position near market close and aim to benefit from the next trading session’s movement.
In the Nifty market, BTST setups are often used to estimate the probable direction for the next day based on price action, momentum, and market sentiment. One lesser-known observational setup involves comparing Normal Candles and Heikin Ashi Candles near market close to identify potential directional probabilities.
This article explains a probability-based BTST Nifty setup that traders can test and analyze for educational purposes.
Important Note: This is an educational trading framework and not financial advice. Every trading strategy should be backtested before using real capital.
The Core Idea Behind This BTST Nifty Setup
The setup focuses on comparing the closing values of Normal Candles and Heikin Ashi Candles at the end of the trading session. The logic behind this method is simple:
- Normal Candles reflect actual market price.
- Heikin Ashi Candles smooth price action to show momentum and trend direction more clearly.
By comparing the difference between these two candle closes, traders attempt to estimate the probable market bias for the next day.
Tools Required for This Setup
To follow this BTST strategy, traders need:
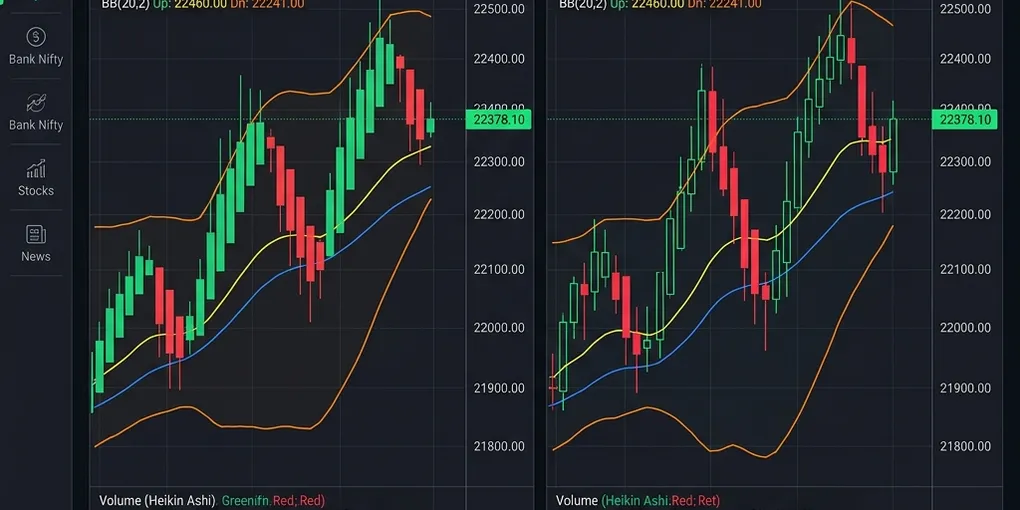
1. TradingView in Dual Chart Mode
Open Nifty in dual chart mode to compare two different candle types simultaneously.
2. Chart Setup Configuration
Configure both charts as follows:
- Left Chart:
- Candle Type: Normal Candlestick
- Timeframe: Daily
- Right Chart:
- Candle Type: Heikin Ashi
- Timeframe: Daily
The idea is to compare the latest daily candle close on both charts around market closing time.
Best Time to Use This Setup
The observation is performed at approximately 3:15 PM, near market close. At this stage, traders monitor the closing behavior of the current candle to understand market momentum heading into the next trading day.
Example Observation
Suppose the market shows:
| Candle Type | Closing Value |
|---|---|
| Normal Candle | 23,815 |
| Heikin Ashi Candle | 23,895 |
The 10-Point Difference Rule
According to this setup, the difference between the Normal Candle Close and Heikin Ashi Close should ideally be 10 points or more to qualify as a directional signal. This threshold acts as a filter to avoid weak or unclear market conditions.
Probability Rules for Market Direction
This setup follows a probability-based interpretation, not a certainty model.
Scenario 1: Heikin Ashi Close Is Higher Than Normal Close
- Condition:
HA Close (Right Chart) > Normal Close (Left Chart) - Probability Bias: The market may move downward in the next session.
- Interpretation: This is seen as a potential signal of weakness or reversal probability.
Scenario 2: Heikin Ashi Close Is Lower Than Normal Close
- Condition:
HA Close (Right Chart) < Normal Close (Left Chart) - Probability Bias: The market may move upward in the next session.
- Interpretation: This is interpreted as a potential bullish probability setup.
Trade Execution Strategy for the Next Day
After identifying the signal, follow these steps:
- Wait for Market Open: Do not enter immediately at opening.
- Allow 10 Minutes for Market Stabilization: Wait approximately 10 minutes after market open. This helps avoid:
- Opening volatility
- Fake breakouts
- Overnight gap noise
- Execute and Manage the Trade: Once the market settles:
- Enter based on the identified probability.
- Book profit or loss quickly according to your trading plan.
- Avoid emotional holding.
This makes the setup more suitable for disciplined BTST traders rather than long intraday holding.
Why Traders Use Heikin Ashi in BTST Trading
Professional traders often use Heikin Ashi candles because they reduce market noise. Benefits include:
- Better Trend Visibility: Heikin Ashi smooths short-term fluctuations and highlights momentum.
- Reduced False Signals: Compared to standard candlesticks, trends may appear cleaner.
- Improved Directional Bias: When compared with actual price candles, traders may identify hidden momentum differences.
However, Heikin Ashi should never be used alone. It works best when combined with price action, support and resistance, volume, and market sentiment.
Risk Management for This BTST Setup
No trading strategy guarantees profits. Before applying this setup with capital:
- Backtest the Method: Test it on at least 3 months, 6 months, or ideally 1 year of Nifty historical data.
- Track Metrics: Monitor win rate, average profit, average loss, and false signals.
- Use Position Sizing: Never risk excessive capital on one signal.
- Respect Stop Losses: Probability-based systems work over many trades, not one trade.
Final Thoughts
The BTST Nifty Strategy using Heikin Ashi vs Normal Candles is an interesting observational framework for traders who want to estimate next-day market probability. By analyzing the difference between daily candle closes at 3:15 PM, traders attempt to build a directional bias for the following session.
However, this setup should be treated as a probability model, not certainty. Smart traders do not blindly trust any indicator; they test the setup, collect data, refine rules, and trade with discipline.
Disclaimer: This content is for educational purposes only and does not constitute financial or investment advice. Always do your own research and backtest any trading strategy before investing real money.